Understanding ZYTO Reports can help you make better decisions for the health and wellness of your clients.
Learning to “see” the body’s responses begins by understanding how ZYTO gathers and organizes the data. Familiarize yourself with common report displays, what information is represented, and how it is plotted.
The Dynamic Profile plots the body’s initial energetic responses to stressor Virtual Items. This comprehensive display provides a quick overview of more extreme responses.
Bar charts are most commonly used to compare a collection of Virtual Items that share some kind of relationship. In most cases, the initial response of each Virtual Item is plotted as an absolute value.
Lists are used to display Virtual Item responses in a variety of ways, including positive, negative, in-range, or out-of-range dR values.
Progress charts display what affect Virtual Items (often nutritional product VIs) had on out-of-range readings. It is common to see out-of-range items come into range as each balancer Virtual Item is introduced to the body.
The Vectors page is an interactive tool meant to identify some of the energetic relationships throughout the body. This tool is available in all ZYTO Pro 5.0 software.
ZYTO report data is used as one piece of the puzzle you are assembling on behalf of your client. When making a differential diagnosis, having more information helps practitioners through the process of investigation, comparison, and elimination. Clues will become obvious when you begin to look for patterns, relationships, and trends. Learning to ask effective questions about the data will help draw out these clues when integrating ZYTO reports into your findings.
Before running a ZYTO scan, consider what you already know about your client. This may guide your decisions about what to scan for and what responses you might expect.
ZYTO technology facilitates more comprehensive data gathering.
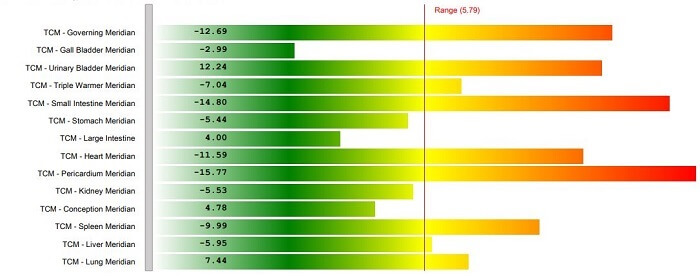
Looking at the original dR values of the stressors or biomarkers, is there a stair-step effect? For example, in this report, the dR values of some Virtual Items are grouped around 80, the next most out-of-range group settled around 40, and a third group was around 20. These might represent a pattern of energetic priority.
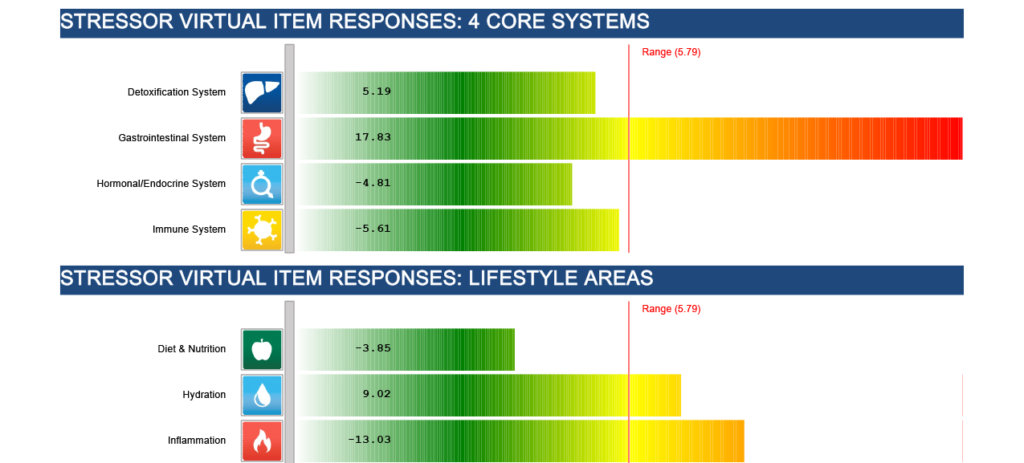
How does the stressor dR compare to the range value? A dR of 60 compared to a range of 40 is less significant than a dR of 25 when the range value is 2.5. The further a stressor dR value is from the range, the more significant the stressor typically is for that person.
If a wide range of products were scanned as balancer Virtual Items, do the preferred products tend to share a common category or indication? In this report, we can see that 4 out of the 6 products effect the respiratory system.
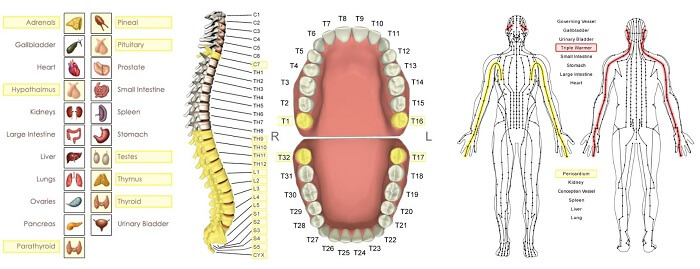
Based on your training, how do the organs or systems represented by the out-of-range biomarkers affect one another? Remember to go to the Vectors tab to see the energetic correlations between organs, vertebrae, teeth, and TCM meridians.
Do these effects correlate with the other information you have collected about the individual, including emotional health?
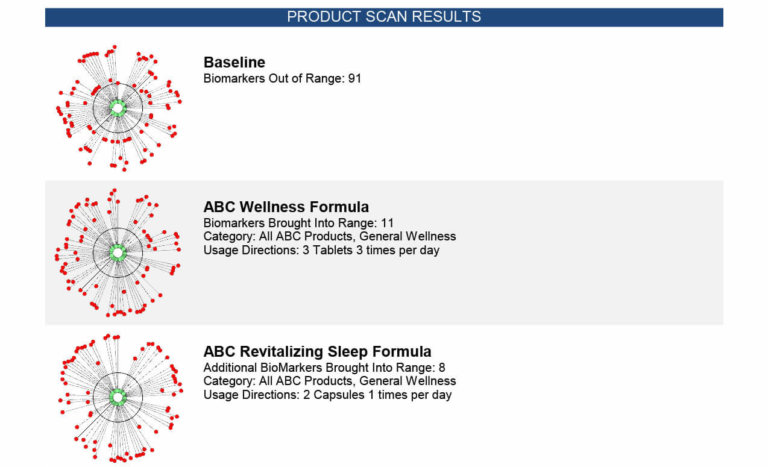
How do the preferred product and service balancers correlate to the stressor Virtual Items or biomarker patterns?
From scan to scan, are there stressor Virtual Items that are commonly difficult to bring into range?
Do the same food Virtual Items show up repeatedly? How do clients feel when these foods are removed from their diet?
In subsequent scans, do you see biologically preferred products that support similar systems (e.g., immune enhancement, cardiovascular support, detoxification, etc.)?