Learn about ZYTO measurements and what’s displayed in the reports.

Galvanic skin response (GSR) data is gathered from the ZYTO Hand Cradle. The software analyzes each response. Responses are gathered and displayed in reports. When paired with other tests and methods, these reports help inform wellness professionals and their clients in making individualized wellness decisions.
The ZYTO Hand Cradle measures and records GSR data. The ZYTO software analyzes how these responses vary from the baseline to determine biological coherence.
When the parts and pieces of a system work in harmony with one another, we call this coherence. Measuring this signal of cooperation, or the lack thereof, provides understanding about what may increase or decrease efficiency.
The ZYTO Hand Cradle measures and records GSR data. The ZYTO software analyzes how these responses vary from the baseline to determine biological coherence.
When the parts and pieces of a system work in harmony with one another, we call this coherence. The greater a system’s coherence, oftentimes the greater its efficiency. Measuring this signal of cooperation, or the lack thereof, provides understanding about what may increase or decrease efficiency.
Each ZYTO scan measures responses to 35 neutral digital signals. The median response to this neutral stimulus becomes the range, or the parameter of the response to energetic stimulus in general. Once the range is established, Virtual Items in the ZYTO software can be compared to the parameters set in the range.
Your body’s energetic state is constantly changing. For this reason, we take multiple galvanic skin response readings via the ZYTO Hand Cradle. The software analyzes these readings in relation to Virtual Items.
A Virtual Item is a unique digital code representing an actual item—a food, product, service, organ, body system, etc. Just like a flight simulator mimics flying in real life, these items represent “situations” that we can analyze from the GSR data gathered by the ZYTO Hand Cradle.
The ZYTO software determines the coherence of each Virtual Item based on the GSR data gathered from the Hand Cradle.
The ZYTO software determines the coherence of each Virtual Item based on the GSR data gathered from the Hand Cradle.
Responses can be sorted and displayed in a variety of ways to make comparisons and decisions during and after a scan is complete. To learn more about what information is displayed after a scan, click below.
Schedule a FREE online software demo to find out how ZYTO technology can enhance client satisfaction and help you grow your wellness business.
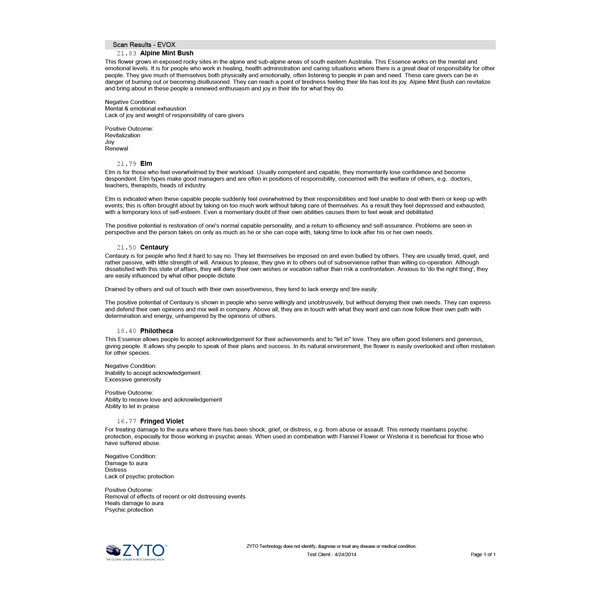
After a scan is completed, most biosurveys automatically generate a report in the Reports tab. This report allows you to access and share the data in various ways.
Many biosurveys offer a variety of reports. Some are better suited to share with your clients, while others are meant for clinical reference only. Find these alternative reports under the Select Reports drop-down menu.
Once a report has loaded, you can print using the PDF toolbar interface.
Send a copy of the report to your client or colleague without wasting paper. Email settings from within the software allow you to use any desktop or browser-based email service you prefer.
Reports are stored and accessible at any time. Simply open the desired client session and choose the Report tab.
“The reports can give the ‘aha’ to both the doctor and the client. And that information is what is going to help us assist people on their journey to wellness.”
– Nick Lamothe, PhD


Reports display information in a preformatted layout, but it’s easy to add your own custom touches.
Brand the reports you give to your clients with your clinic information.
Help clients remember their next appointment by including it in the report header.
Send a copy of the report to your client or colleague without wasting paper. Email settings from within the software allow you to use any desktop or browser-based email service you prefer.
Learn about ZYTO measurements and what’s displayed in the reports.